Kate Kagioglidis
Designer for accessible editorial design
Driven by the pricipale that information should be accessible to all, without compromising aesthetics.
Accessible Documents
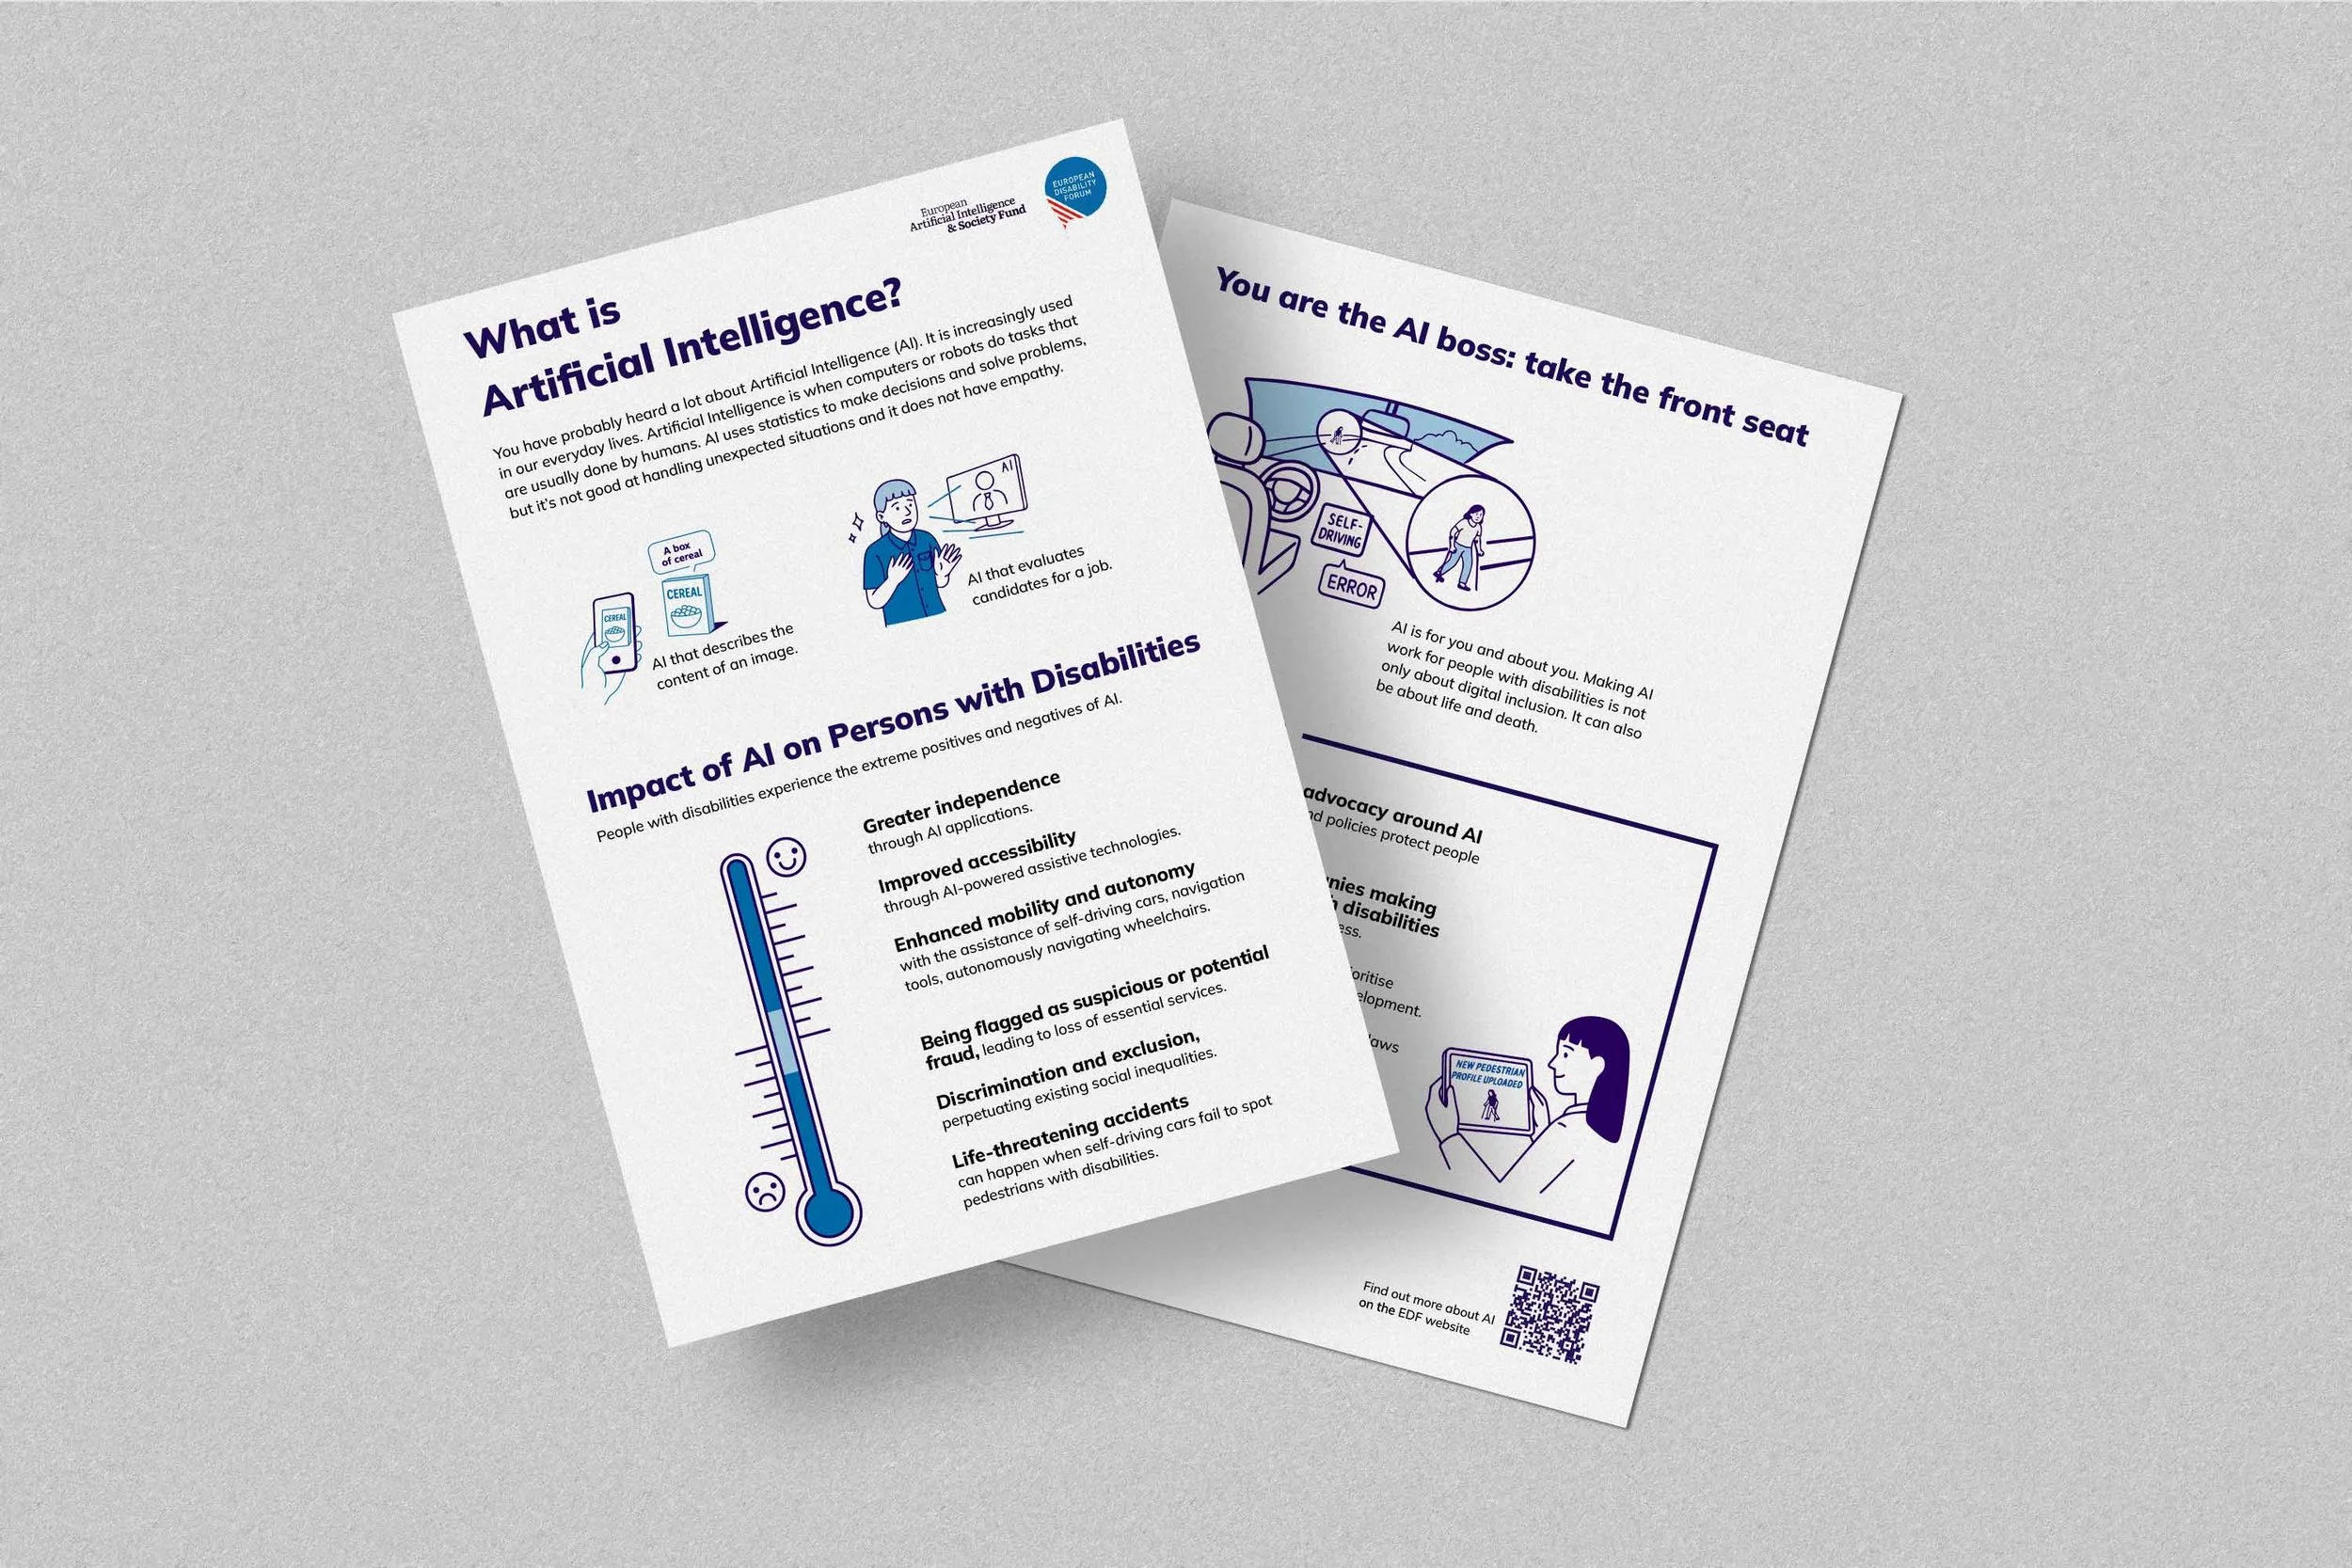
Accessible AI Infographics for the European Disability Forum (EDF)
AccessAble Guide Luxembourg
A two-part infographic series designed to make the impact of AI on persons with disabilities visible, understandable, and accessible — combining clear visual language, inclusive representation, and strong information hierarchy to help persons with disabilities, policymakers, and developers understand risks, opportunities, and responsibilities in inclusive AI.

During my traineeship at the European Parliament’s Digital Accessibility Team, I ensured the AccessAble Guide for Luxembourg—a collaboration between multiple EU institutions—was fully accessible (view Accessibility Report (PDF)). This 32-page resource helps newcomers navigate accommodation, transport, and leisure.
I handled content remediation to refine the guide for maximum usability, ensuring it meets accessibility standards.

Civic Data Lab – Toolkit for Data Projects Implementation
The material created (with Marko) for Corellaid offers comprehensive guidance and resources for successfully executing data initiatives within the civil society sector. This toolkit provides practical instructions and essential resources to facilitate the effective planning, execution, and evaluation of data projects, ensuring impactful outcomes. The worksheets are designed for flexibility, usable on Miro (online whiteboard), as printed materials, or as an interactive, accessible PDF form (view accessibility report (PDF)).

Zukunft ist jetzt!
Accessible Event Brochure
An accessible, visually cohesive brochure for the Zukunft ist jetzt! [The Future is Now!] conference, meeting PDF/UA standards (view accessibility report (PDF)) to ensure usability for all readers, including those using assistive technologies. The layout balances clarity and inclusivity, offering content in both easy and complex language versions. The conference focused on inclusive artistic education, pathways for creatives with disabilities to study at universities and alternatives of artistic education.
Guide for Assistive Tools Development
Leveraging experiences from the Open Health HACKademy and design-thinking principles to create and accessible guide for co-creation of assistive tool.

Inclusion by Default:
Everyday Tools for Accessilbity
Whitepaper and Prototype
Reimagine a world where inclusion is not an afterthought but a fundamental part our of every environment and experience. Let’s be equipped with the knowledge and tools to make a difference, one checklist at a time.
Infographics

Flushing down data
The mundane act of flushing a toilet unveils a remarkable journey of data collection and analysis. In this exploration, we delve into how everyday sewage systems serve as a reservoir of valuable information, offering insights into public health, societal trends, and environmental impacts.

Let’s talk toilet paper
A data visualization project aimed at shedding light on the consumption and production resources associated with toilet paper and its alternatives. The project seeks to raise awareness about effective and sustainable alternatives for personal hygiene.

Feel the scent
Exploring the transformation of synthetic scents into tangible objects using algorithms and 3D-printing, this project delves into scent descriptions and classifications. Scents become tangible to both smell and touch. This approach facilitates a deeper understanding of scents, making them accessible and tangible.
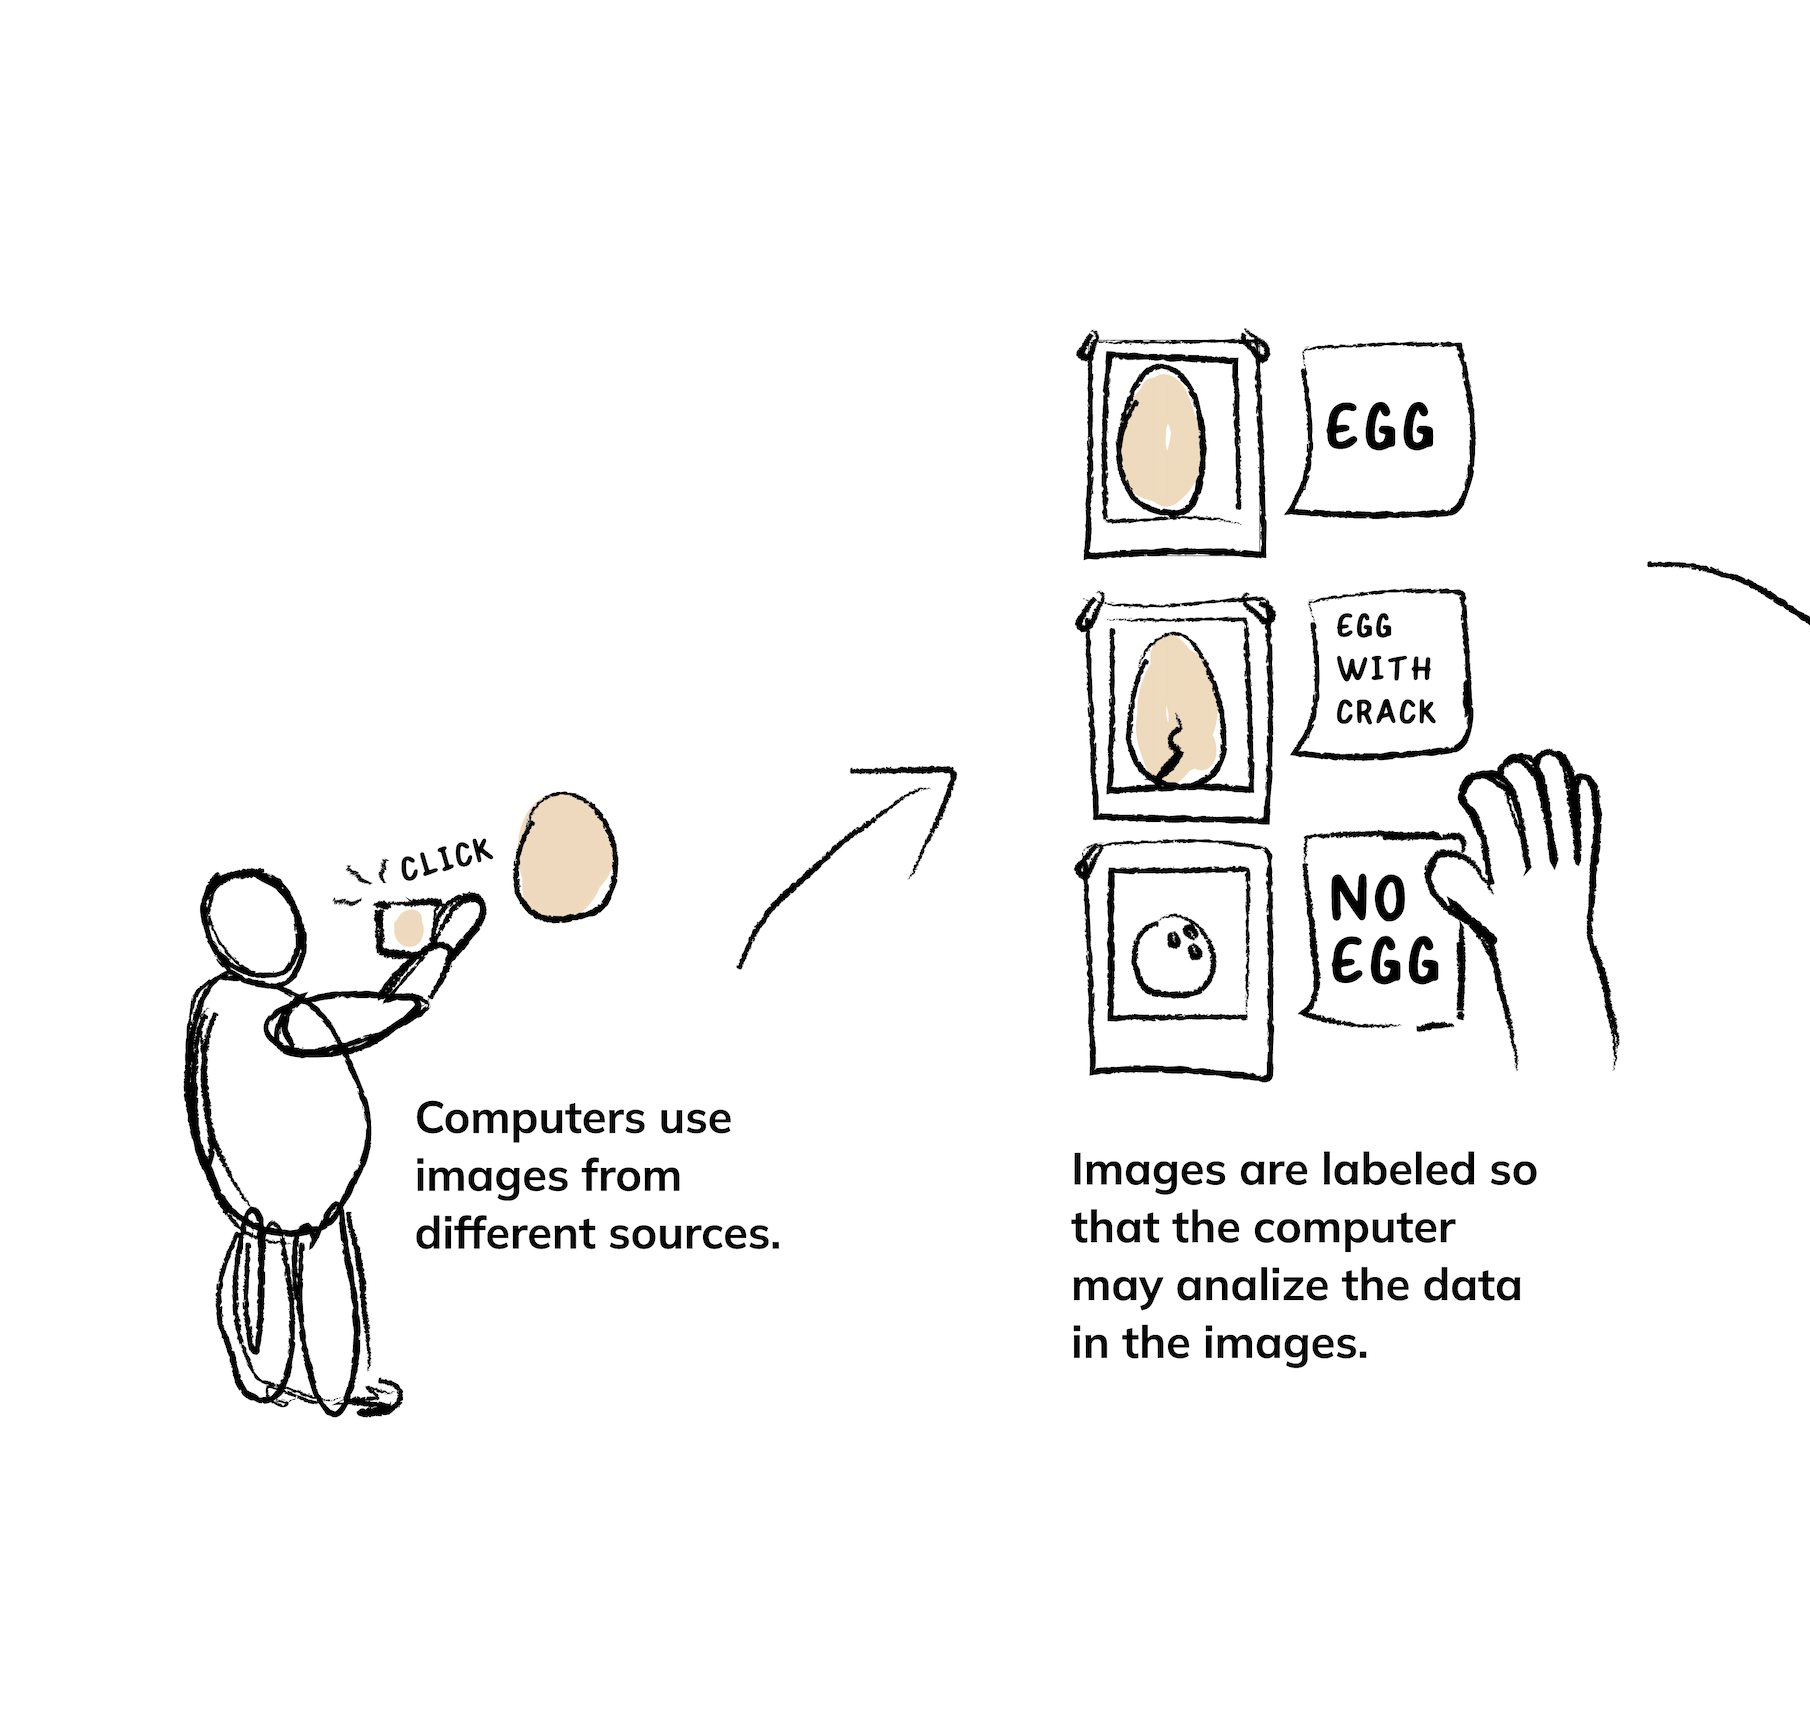
An Infographic explaining Computer Vision and its Applications
The goal was to make that complex topic accessible through a visual explanation. Simple explanations, engaging visualizations, and visually appealing design.
Clients


About
I'm Kate Kagioglidis, a designer specialised in accessible editorial design, data visualisation, and digital publishing.
I create visually coherent, structured, and accessible content—from reports and infographics to templates and institutional documents. Ensuring compliance with WCAG, PDF/UA, and European Accessibility Standards, I help institutions, NGOs, and businesses produce inclusive digital and print materials that are both aesthetically refined and fully accessible. Driven by the principle that information should be accessible to all, without compromising aesthetics.
-
Since July 2025
Consultant for the European Parliament (employed by Cronos Europa)
I support the Competence Centre for Digital Accessibility (CCDA) within DG ITEC. My work focuses on improving the accessibility of digital content, including documents, presentations, and web materials, and on designing visuals and tutorials for accessibility training and events. I also contribute to the Digital Accessibility Roadmap and support the Digital Accessibility Officers Network (DAON) in advancing inclusive practices across the institution.
Oct 2024 - Feb 2025
Schuman Trainee at the European Parliament (Brussels, Belgium). DG ITEC Digital Accessibility Team
Supporting the Parliament’s Digital Accessibility Roadmap involves auditing and remediating digital content according to WCAG and EU standards, monitoring accessibility, engaging stakeholders, maintaining databases, developing resources, organising events, and analysing policies to promote best practices in digital accessibility.
Dec 2023 - Feb 2024
Civic Data Lab (Berlin, Germany)
Toolkit development for civil society data projects
Feb 2023 - Jan 2024
EUCREA e.V. (Hamburg, Germany)
Editorial Design (e.g. Zukunft ist Jetzt Event), Branding and Accessibility Testing.
Dec 2022 - Oct 2023
STADT R A U M FLUSS (Hamburg, Germany)
Multimedia Design and Communication Strategy
Since Dec 2021
Be able e.V. (Berlin Germany)
Inclusive Graphic Designer and Project Contributor
For projects like Match My Maker
June 2019 - Nov 2021
Sea Natives Surf Camp (Tocha, Portugal)
-
2024
Master: Data and Design at ELISAVA Barcelona School of Design and Engineering (Spain)Mention in Research at ISEC Lisbon (Portugal)
2021
Data Visualization and Informationdesign at the LCC London (UK)2019
Bachelor of Industrialdesign at the Kunsthochschule Burg Giebichenstein Halle (Germany)2017/18
Erasmus+ Crossmedia Design at the ArtEZ AKI in Enschede (Netherlands)2013
Abitur and Design and Media Technology Graduation -
Document Accessibility: Skilled in ceating and remediating WCAG, PDF/UA, and EU standard conformant PDFs, forms, Word documents, and PowerPoint presentations, including complex layouts in Adobe InDesign.
Adobe Creative Suite: Expert in InDesign, Illustrator, Proficient in Photoshop, and Lightroom. Familiar with After Effects.
Web Design: Proficient in Squarespace, Wix Editor X, Readymag and WordPress. Experienced in screen reader compatibility and SEO optimization.
Video Editing: Competent in Adobe Premiere Pro, DaVinci Resolve, and iMovie.
Data Visualization: Proficient in RAWgraphs, Flourish, Tableau, and QGIS for spatial data analysis.
Programming: Knowledge of HTML, familiar with creative coding languages like Processing and P5.js.
Canva: Expert in template creation.
Social Media: Competent in social media management and email marketing platforms.z